
For investors who want to understand what’s really happening in technology markets
What Actually Drives Technology Markets — And Why Most Investors Are Watching the Wrong Thing

The force that explains the biggest moves in tech stocks isn’t in any earnings report. Here’s what it is — and why it matters more than anything else you’re watching.
If you’ve been investing in technology stocks for any length of time, you’ve probably had this experience.
The market does something that makes no sense.
A company reports strong earnings. The stock falls. An analyst upgrades their price target. Nothing happens. The Fed signals a pause in rate rises. Tech rallies hard — not because anything fundamental changed, but because something shifted in the broader environment.
And then there are the bigger moments. The 2022 crash. The NASDAQ down nearly 35% in a single year, despite the fact that artificial intelligence — the most significant technological development in a generation — was advancing faster than anyone had predicted. The underlying story hadn’t changed. The stock prices had.
Then 2023. A recovery that caught most investors off guard. Not because AI suddenly became more real. Not because valuations had compressed to bargain levels. Something else had shifted — and the market moved accordingly.
Most investors explained these moves after the fact with whatever narrative was available. Rates. Sentiment. Recession fears. The Fed.
These explanations aren’t entirely wrong. But they’re surface level. They describe the weather without explaining the climate.
There is a force that explains the climate. And the majority of retail investors have never looked at it.
What Most Investors Are Actually Watching
The conventional framework for technology investing goes something like this.
You look at valuations — price-to-earnings ratios, price-to-sales multiples, discounted cash flow models. You follow analyst ratings and price targets. You track earnings beats and misses. You listen to Fed commentary and interpret what it means for growth stocks. You read about AI developments and try to assess which companies are best positioned.
None of this is useless. Earnings matter. Valuations matter. The competitive landscape matters.
But here’s the problem.
If this framework were sufficient, the investors using it most rigorously would consistently outperform the market. The evidence suggests they don’t. Professional fund managers — with teams of analysts, proprietary data, and decades of experience applying exactly this framework — underperform passive index exposure the majority of the time over meaningful periods.
Something is missing from the model.
The investors who navigated 2022 correctly — who reduced technology exposure before the crash and rebuilt it before the recovery — weren’t better at reading earnings reports. They were tracking something entirely different.
[See also: Are Tech Stocks Still a Good Buy — Or Have You Already Missed It? — for a deeper look at why the conventional valuation framework consistently gets the timing wrong]
The Force That Actually Moves Markets
The single most powerful driver of technology market performance is global liquidity.
Not earnings. Not valuations. Not Fed commentary.
Global liquidity — the total supply of money flowing through the financial system.
This isn’t a theory. It’s one of the most well-documented relationships in modern financial markets, built on a substantial body of institutional macro research developed and refined over decades. The historical relationship between global liquidity conditions and NASDAQ performance is extraordinarily consistent — tighter than the relationship between earnings growth and index returns, tighter than GDP correlation, tighter than almost any other macro element you could name.
The mechanism isn’t complicated once you see it.
There’s a free resource that maps exactly how this has played out across technology markets since 2018 — every major surge, every drawdown, every recovery, tracked against global liquidity conditions. If you want to see the pattern before reading any further, you can get it here.
When liquidity is abundant — when central banks are expanding their balance sheets, when money supply is growing, when the conditions that create freely flowing capital are in place — that capital has to find a home. It flows toward the highest-growth, most liquid assets available. Technology stocks, particularly the large-cap AI and software names that dominate the NASDAQ, sit at the top of that preference stack. They attract disproportionate inflows during liquidity expansions.
When liquidity contracts — when central banks tighten, when money supply growth slows or reverses, when the conditions that restrict capital are in place — the same assets that attracted the most inflows face the steepest selling. Not because their businesses have deteriorated. Because the macro environment has shifted.
This is why valuation arguments about technology stocks are consistently wrong on timing. A stock can be expensive by conventional measures and keep rising for years if liquidity conditions support it. It can look reasonably valued and fall hard if liquidity contracts. The valuation is real. But it isn’t the governing force.
Liquidity is.
What the Historical Record Shows
The relationship between liquidity conditions and technology market performance becomes clear when you look at the major market phases of the last several years.
The chart below shows NASDAQ price performance overlaid with liquidity conditions — green periods where liquidity was expanding, red periods where it was contracting.
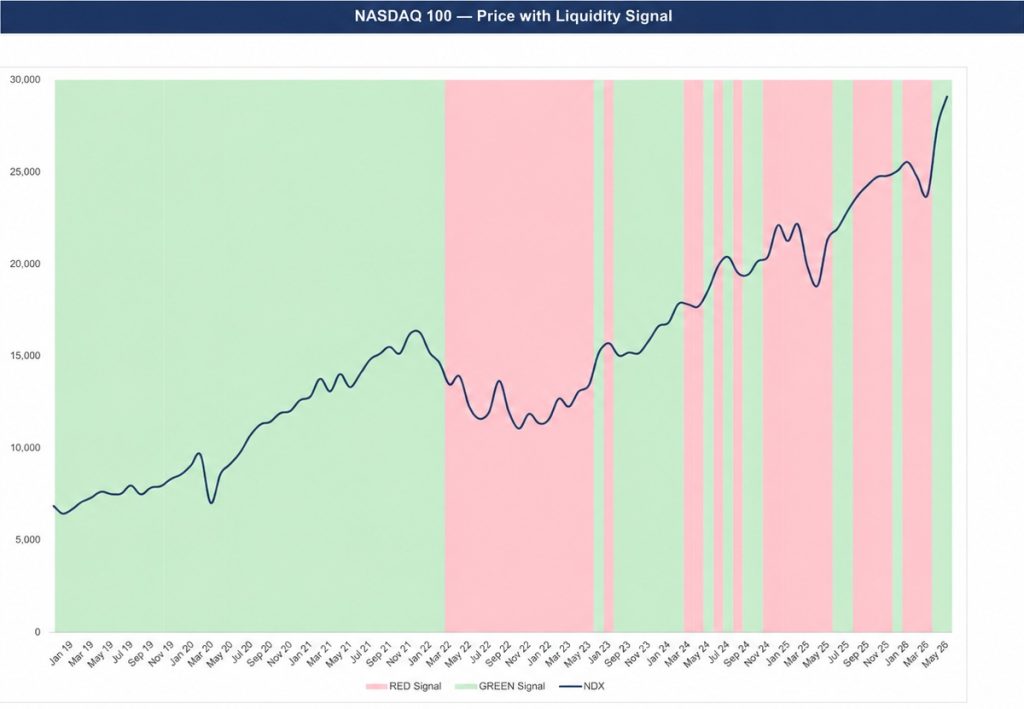
Look at where the major advances occurred. Look at where the significant drawdowns began.
They follow the cycle with a consistency that is difficult to attribute to coincidence.
2020 — The COVID Crash and Recovery
The COVID crash in early 2020 was one of the fastest market declines in history. What followed was one of the fastest recoveries. The conventional explanation focused on vaccine development, fiscal stimulus, and the shift to digital working. These were real factors. But the underlying driver was a historic expansion of liquidity — central banks flooded the financial system with capital on a scale that had no modern precedent. Technology stocks, as the primary beneficiary of liquidity expansion, led the recovery and then kept going.
2022 — The Bear Market
The 2022 bear market is the clearest illustration of the liquidity mechanism at work. The Federal Reserve raised interest rates at the fastest pace in decades. Global liquidity contracted sharply. The NASDAQ fell nearly 35%. The narrative focused on rates killing growth stock valuations. That’s not wrong — but it’s a description of the mechanism, not the cause. The cause was liquidity contraction. Rates were the instrument. Liquidity was the force.
Critically — AI did not stop being a compelling theme in 2022. The underlying technology kept advancing. The stocks fell anyway, because the macro environment had turned hostile regardless of the fundamental story.
2023–2025 — Recovery and the AI Surge
The recovery from the 2022 lows began before most investors expected it and extended further than most predicted. Liquidity conditions had begun to shift. Capital started flowing back into risk assets. The AI narrative provided the story investors used to explain the move. The liquidity environment provided the conditions that made the move possible.
The pattern across all three phases is the same. Liquidity expands — technology markets advance. Liquidity contracts — technology markets fall. The narrative changes each time. The mechanism doesn’t.
See the Pattern Behind the Biggest Moves in Tech
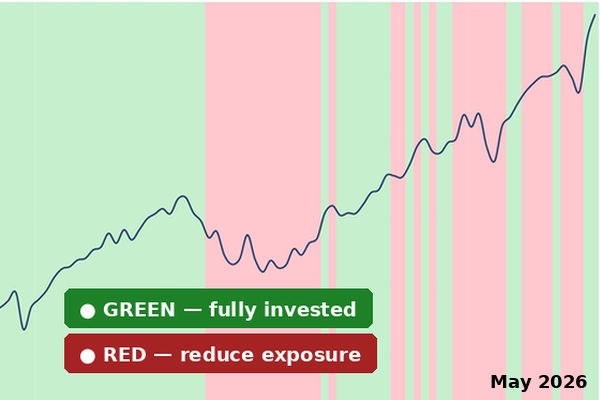
The Liquidity Map shows how global liquidity conditions have tracked against technology market performance since 2018 — the surges, the drawdowns, and the recoveries. Every major phase, laid out clearly in one place.
Free. About ten minutes to read.
Why You Don’t Hear About This
If this relationship is as well-documented and consistent as the evidence suggests, why isn’t it the dominant framework in retail investing commentary?
A few reasons.
The data isn’t simple to access or interpret. Global liquidity is a composite of multiple inputs — central bank balance sheets, money supply figures, government fiscal dynamics, cross-border capital flows. Assembling those inputs into a coherent picture requires access to institutional data sources and a methodology for combining them meaningfully. This is work that professional macro analysts do. It isn’t packaged for retail consumption.
The financial media has no incentive to explain it. Liquidity analysis doesn’t generate daily commentary. It doesn’t produce hot takes or urgent calls to action. It produces a slow-moving assessment of conditions that changes infrequently. That’s not how financial media generates engagement.
And frankly, it challenges a lot of the activity that generates revenue for the financial services industry. If the primary driver of technology market performance is a macro element largely outside any individual company’s control, the case for active stock selection within the technology sector becomes considerably weaker. That’s an uncomfortable conclusion for an industry built on stock picking.
The result is that one of the most robust and well-researched relationships in modern markets remains largely invisible to the investors who would benefit most from understanding it.
What This Means for Your Portfolio
Understanding that liquidity drives technology markets reframes the questions worth asking.
The question isn’t “which tech stocks should I own?” — at least not as the primary question.